Adding Process KPIs to a Dashboard
Displaying KPIs on a Dashboard
All KPIs defined for all processes are available to add to a Dashboard. See the section on creating Dashboards to learn how to create and configure Dashboards.
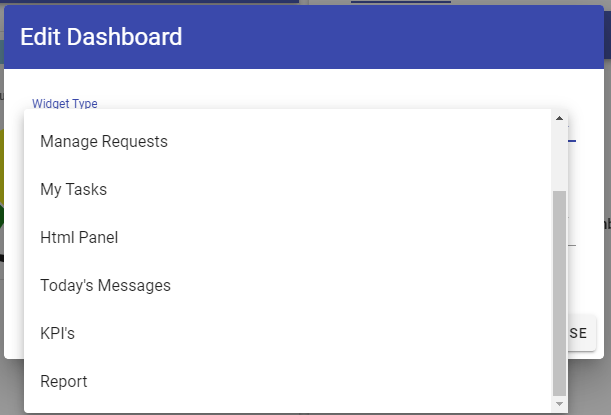
1. To add a KPI to a Dashboard, go to the Layout page of the Dashboard. Click the ADD WIDGET button.

2. Click the Add Item button next to the KPIs Widget. The Add KPI Widget dialog box will display.
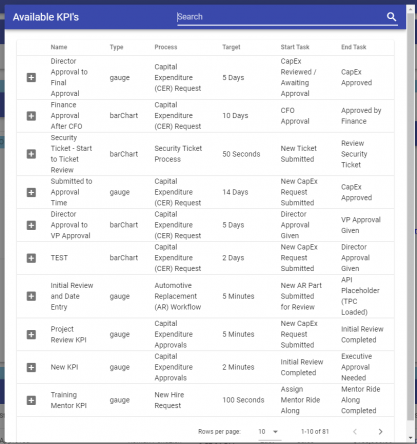
3. Click the Add KPI button that is next to the name of the KPI you want to add to the Dashboard.
5. Search for the KPI you wish to add by name and click on the "plus" button on the left side of the display list.
The selected KPI(s) will then display on the Dashboard where you can size and position the widget panel. You will need to click the "Save" button on the upper right menu to store your changes.
Using the KPIs on a Dashboard
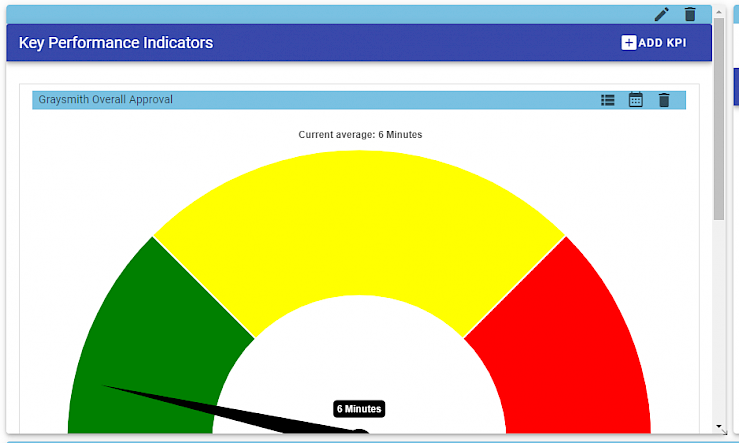
The KPIs will display on a Dashboard, similar to the diagram shown below.
Notice that these Dashboard KPI widgets are shown only the Average timespans for all of the requests included in the defined date range. Notice that, if the Allow edit KPI date options is toggled on in the KPI definition, an icon  will display to change the timespan.
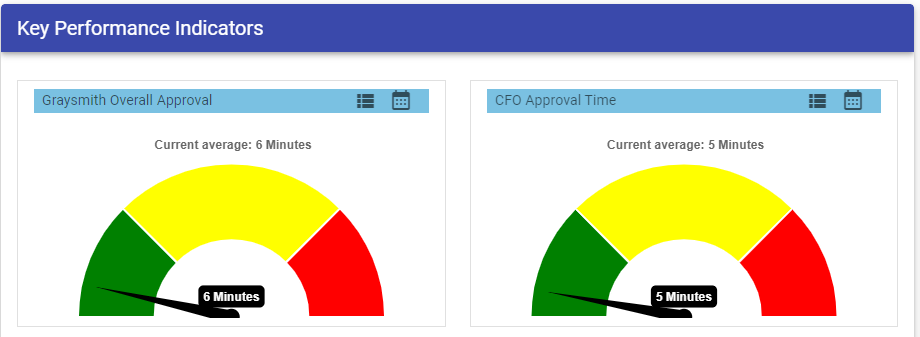
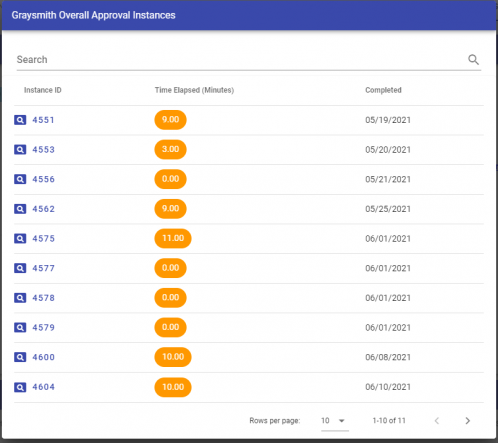
A Show Process Requests icon  also displays that will open a dialog box with a list of all the Requests that are included in the KPI timespan. The KPI status (Yellow, Green, Red) is shown for each Request, and you're able to click the View icon to open any of the Requests in the list.
If you click on the KPI chart, a dialog will open that shows the date and times of the timespan included and the names of the Start Task and End Task defined for the KPI.