Displaying KPIs for an Individual Request
KPIs can be displayed in either the Request Detail for individual requests or summary data using the KPI Widget on a Dashboard. Whether or not the KPI displays for individual requests is selected by the Process Designer when they define the KPI.
When you have a request open, click on the REQUEST DETAIL tab. Then, expand the KPI Charts section.
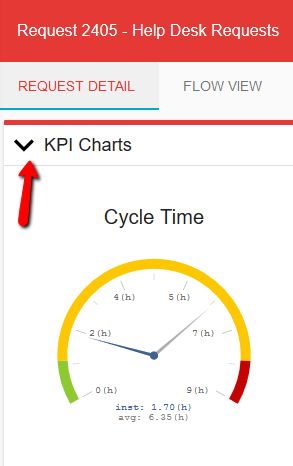
All KPIs defined for the process, and have the Show in Request Detail option toggled on, will show in this section. In Request Detail, both the Gauge and Bar Chart KPIs display the KPI time measurement for the individual Request (inst.) and the average for all requests (avg) within the defined time span.
The Green, Yellow, Red divisions indicate where the KPI measurement falls within the defined Target and Upper Threshold times. Green indicates the time is at or below the Target Time defined by the KPI. Yellow indicates the time is between the Target Time and Upper Threshold. Red indicates that the time is above the Upper Threshold time.