Report Chart Options
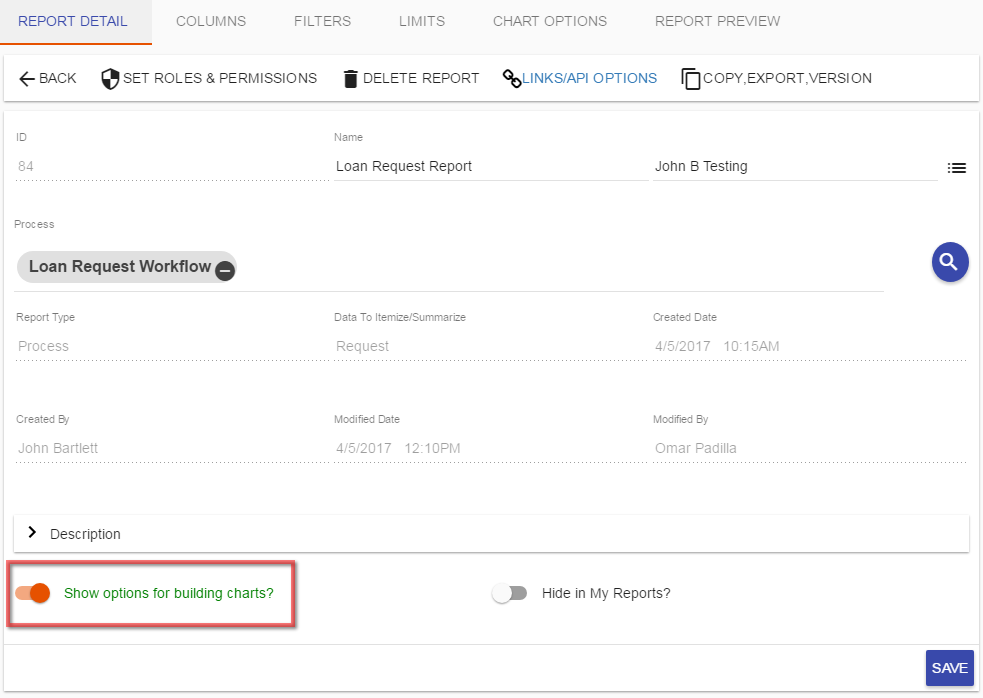
If you'd like to have the option to build and display charts when creating your report you can toggle the "Show options for building charts" button on the Report Detail tab.
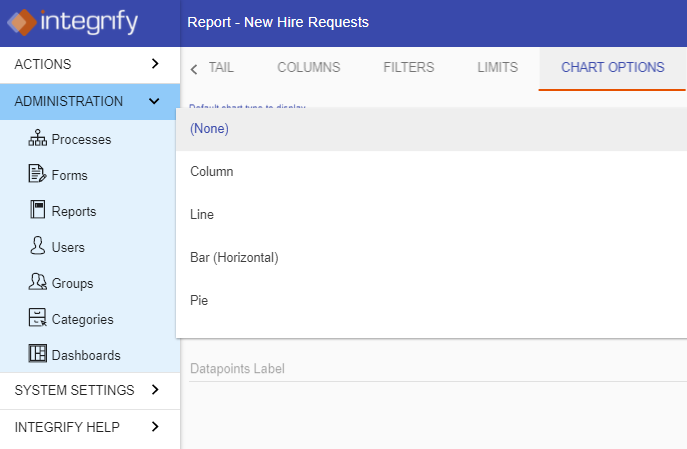
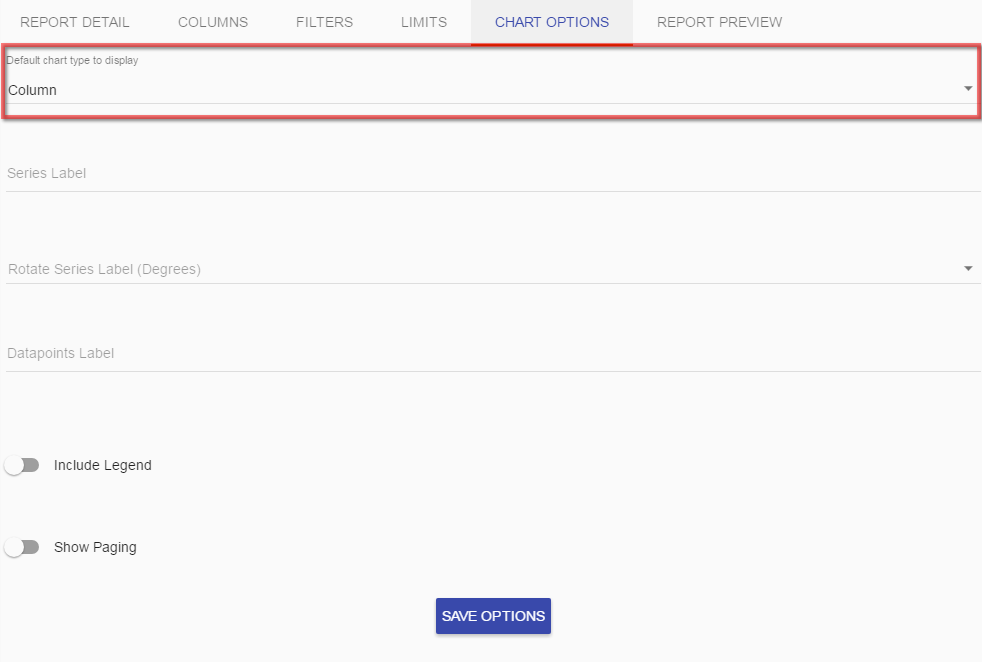
You can then use the Chart Options tab to define the type of chart you want to display and the maximum number of data points for your chart:
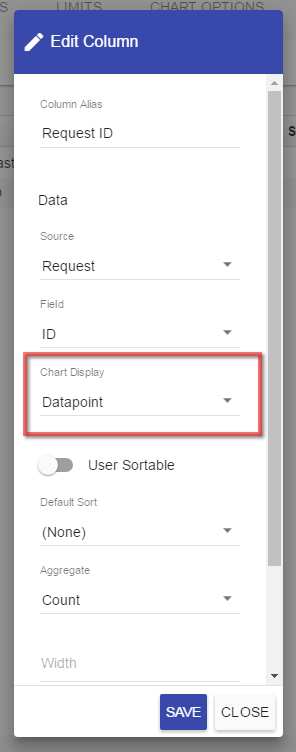
Note: you must define the Datapoint and Series columns under the Chart Display option when adding columns to your report for the chart to display. The datapoint series may need to be aggregated with a built-in function for the chart to work (for example, Totaling a column). It is often helpful to build the report without the Chart option first to make sure the data is being aggregated correctly before designing a chart based report:
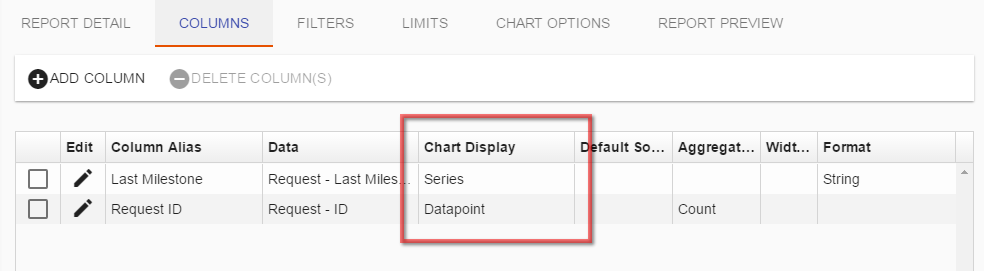
To set, choose the Chart Display option for the column you want to set as the Datapoint or Series:
Note: Make sure to define the type of chart (line, pie, bar, area, or column) under the Chart Options tab. There are several other options on the Chart Options tab, including:
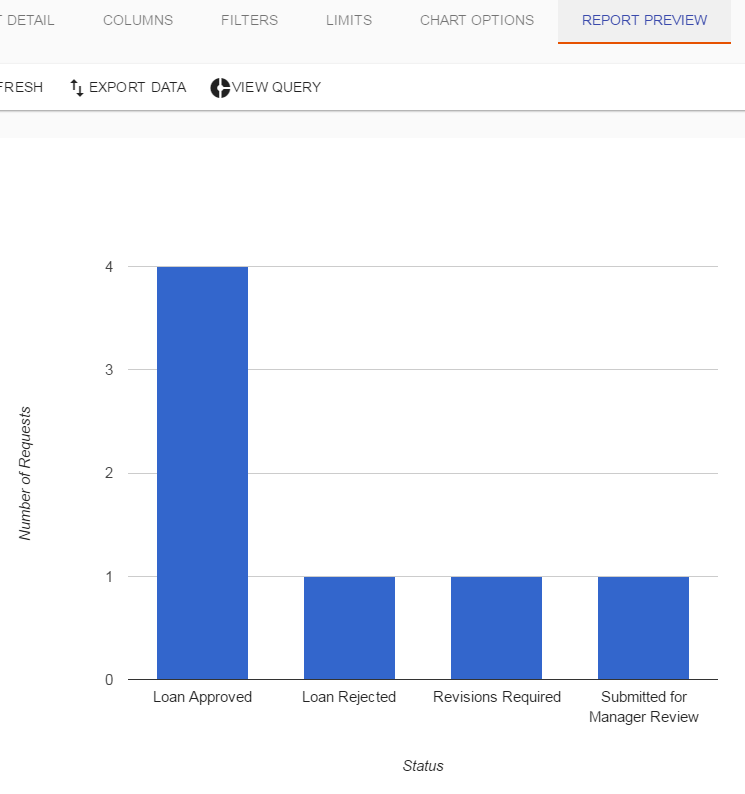
An example of the resulting chart display: